
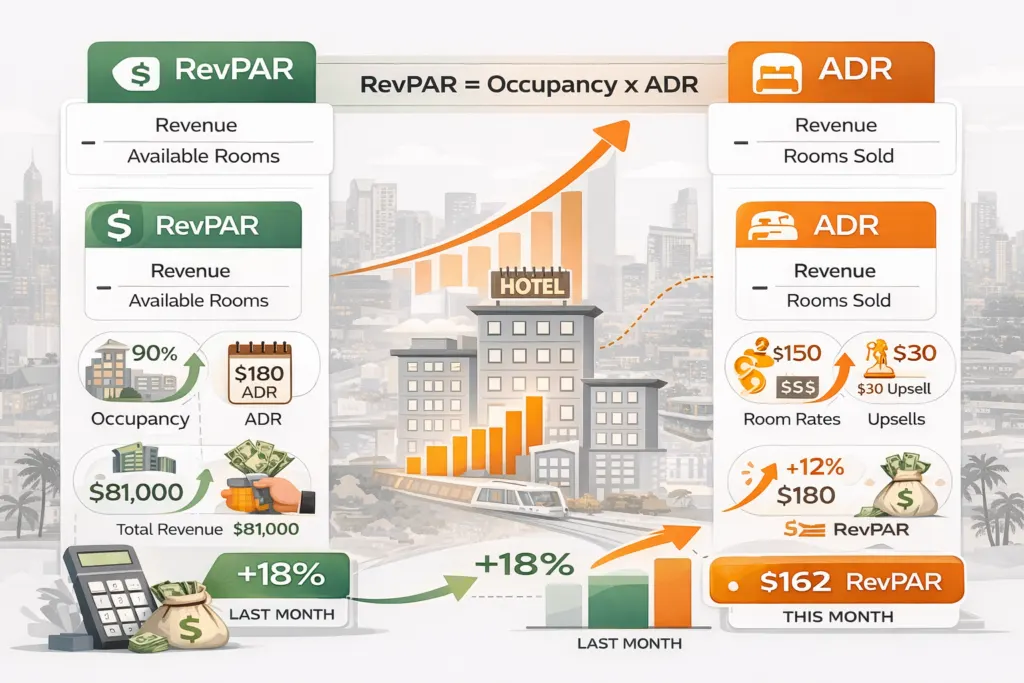
The core difference between RevPAR (Revenue Per Available Room) and ADR (Average Daily Rate) is that ADR measures the average price paid strictly for occupied rooms, whereas RevPAR calculates revenue performance across all available rooms in the hotel, whether sold or unsold. While ADR serves as an excellent benchmark for pricing power and market positioning, RevPAR is the gold-standard metric for overall operational efficiency because it automatically penalizes a property for failing to fill its inventory.
Table of Contents
- What Is RevPAR?
- What Is ADR?
- When ADR Rises but RevPAR Falls
- TRevPAR and NRevPAR
- Practical Benchmarks
- RevPAR in the Hotel Industry
- How Propeter Optimises for RevPAR
- Frequently Asked Questions
Ask ten hotel professionals which single metric best captures revenue performance and the majority will say RevPAR. Ask a different ten and some will say ADR. Both groups are partly right — and partly missing the point. RevPAR and ADR are complementary metrics that, when understood together, give a complete picture of hotel revenue performance. Used in isolation, each tells an incomplete story. Misread, they lead to exactly the wrong pricing decisions.
Propeter is built around RevPAR as the primary optimisation target — not ADR in isolation, not occupancy in isolation — because RevPAR is the metric that best captures the trade-off between rate and fill that defines intelligent pricing. Every rate recommendation is evaluated against its projected RevPAR effect, not against a rate-maximisation or occupancy-maximisation objective.
What Is RevPAR?
RevPAR stands for Revenue Per Available Room. It is the single metric that best captures a hotel’s ability to generate rooms revenue from its total room supply — including both rooms that were sold and rooms that went unsold.
The RevPAR Formula
There are two equivalent ways to calculate RevPAR:
- RevPAR = Total Rooms Revenue ÷ Total Available Rooms
- RevPAR = ADR × Occupancy %
Both formulas give the same result. The second is more commonly used in revenue management because it makes explicit the two levers that drive RevPAR: the rate achieved on occupied rooms (ADR) and the percentage of available rooms that were occupied (Occupancy %).
Why RevPAR Matters
RevPAR is the preferred top-level performance metric in hospitality because it penalises unsold inventory. A hotel with an ADR of £200 but 50% occupancy achieves a RevPAR of £100. A hotel with an ADR of £150 but 80% occupancy achieves a RevPAR of £120. Despite the lower rate, the second hotel generated more revenue per available room. RevPAR captures this trade-off; ADR alone does not.
For investors, lenders, and asset managers, RevPAR is the primary performance benchmark because it reflects the total revenue-generating efficiency of the room inventory — the hotel’s core asset. Year-over-year RevPAR growth is the metric most closely watched by hotel owners and operators alike.
What Is ADR?
ADR stands for Average Daily Rate. It measures the average rate achieved per occupied (sold) room, excluding rooms that went unsold.
The ADR Formula
ADR = Total Rooms Revenue ÷ Total Rooms Sold
ADR is a pure pricing metric. It tells you what the hotel actually charged (on average) for the rooms it sold. A rising ADR indicates that the hotel is successfully raising rates — either because market conditions are improving, because demand is strong, or because rate management strategy is effective.
When ADR Is the Right Focus
ADR is most useful as a diagnostic tool and rate positioning benchmark. When a hotel’s RevPAR underperforms the compset, understanding whether the gap comes from occupancy (MPI, the occupancy index) or rate (ARI, the ADR index) tells the team where the problem lies. If ADR is in line with compset but occupancy is low, the pricing strategy may not be the issue — distribution, visibility, or product perception might be. If ADR is below compset but occupancy is high, the hotel is discounting unnecessarily and leaving rate on the table.
The ADR Trap
One of the most common revenue management errors is optimising for ADR rather than RevPAR. A hotel that refuses to fill with any booking below a high ADR target may achieve an impressive average rate — but if occupancy is 55% as a result, RevPAR will be poor. Propeter evaluates each recommendation against projected RevPAR impact, not rate alone.
When ADR Rises but RevPAR Falls
This is one of the most important revenue management failure patterns and one of the most frequently misunderstood. It happens when a hotel raises rates aggressively (ADR increases) but the price increase suppresses demand sufficiently that occupancy drops more than proportionally — resulting in a lower overall RevPAR.
Consider an example:
- Scenario A: ADR £180 × 75% occupancy = RevPAR £135
- Scenario B (rate increase): ADR £210 × 58% occupancy = RevPAR £121.80
In Scenario B, the hotel has a higher ADR — which looks good in rate performance reports — but a lower RevPAR. The rate increase destroyed value by suppressing demand too aggressively. This failure mode is particularly common when hotels set rate floors too high during low-demand periods, when they fail to adjust rates in response to competitive undercutting, or when they apply blanket rate increases without evaluating price elasticity by segment.
Demand Elasticity and RevPAR
The relationship between rate changes and occupancy changes is governed by price elasticity — the sensitivity of booking demand to price. Elasticity varies by segment (corporate travellers tend to be less price-sensitive than leisure guests), by booking channel (OTA bookers tend to be more price-sensitive than direct bookers), by lead time (last-minute bookers are often less price-sensitive as alternatives are limited), and by competitive context (the more alternatives exist, the more elastic demand is).
Propeter’s XGBoost and LSTM forecasting models estimate elasticity implicitly by learning from historical rate-occupancy relationships across all segments and channels, producing RevPAR-optimal rate recommendations that reflect the actual price sensitivity of the hotel’s demand mix.
TRevPAR and NRevPAR
Beyond rooms revenue, two extended metrics are increasingly important as hotels focus on total guest value rather than room revenue alone.
TRevPAR (Total Revenue Per Available Room)
TRevPAR includes all hotel revenue — rooms, food and beverage, spa, fitness, parking, events, and other ancillary streams — divided by total available rooms. It provides a comprehensive view of revenue performance particularly relevant for full-service hotels where F&B and ancillary revenue are significant.
A hotel with a room RevPAR of £100 might have a TRevPAR of £145 if F&B and ancillary revenue add £45 per available room. Optimising TRevPAR often means accepting slightly lower room rates in exchange for guests who spend heavily in other outlets — a trade-off that pure RevPAR management misses. Propeter’s upsell rules address this by incorporating expected ancillary revenue when upgrade and add-on offers are priced.
NRevPAR (Net Revenue Per Available Room)
NRevPAR subtracts distribution costs — OTA commissions, GDS fees, metasearch costs — from room revenue before dividing by available rooms. It measures the actual revenue retained after the cost of acquisition. Because OTA commissions typically range from 15–25%, the difference between RevPAR and NRevPAR can be substantial, particularly for OTA-heavy hotels.
NRevPAR is why Propeter’s Direct Booking Engine and channel optimisation features matter strategically: shifting a booking from an OTA at 20% commission to a direct booking at near-zero acquisition cost improves NRevPAR meaningfully — often by more than a moderate rate increase would.
Practical RevPAR and ADR Benchmarks
RevPAR and ADR benchmarks vary enormously by market, hotel type, and seasonality. The most useful benchmarks are always relative — your hotel’s performance versus your compset and versus your own prior-year performance. That said, some general reference points are useful:
- A Revenue Generation Index (RGI, also called RevPAR Index) above 1.0 means you are outperforming your compset on a total revenue-per-room basis
- Consistent year-over-year RevPAR growth of 3–5% in a stable market indicates strong revenue management performance
- RevPAR growth exceeding ADR growth means occupancy is contributing positively — a sign of healthy demand management
- ADR growth exceeding RevPAR growth means occupancy is declining — worth investigating for pricing or demand issues
RevPAR in the Hotel Industry: How the Metric Is Actually Used at Scale
RevPAR’s role in the hotel industry extends well beyond the revenue management dashboard. It is the primary language of hotel investment, asset management, brand performance reporting, and competitive market analysis. Understanding how the industry uses RevPAR — not just how to calculate it — is what separates operators who track a metric from operators who make decisions from it.
RevPAR as an Investment and Lending Metric
Hotel lenders, investors, and asset managers evaluate RevPAR as the core indicator of a property’s revenue-generating capacity relative to its room inventory. When a hotel is valued, sold, or refinanced, RevPAR performance versus the competitive set — measured via the Revenue Generation Index (RGI) — is one of the first figures a buyer or lender examines.
An RGI consistently above 1.0 (meaning the property captures more than its fair share of available market revenue) supports a premium valuation. An RGI below 1.0 signals either a pricing problem, a distribution problem, or a demand generation problem — each with different remediation costs that affect the asset’s investment case.
For hotel owners without daily revenue management engagement, this is the single most important RevPAR application to understand: your RevPAR does not just measure last night’s performance — it determines what your asset is worth.
RevPAR Index (RGI), MPI, and ARI: The Three Competitive Metrics Most Operators Miss
Standard RevPAR tells you how your hotel performed. The RevPAR Index — and its two component metrics — tells you how your hotel performed relative to your market. This is the distinction most RevPAR content fails to explain properly.
RGI (Revenue Generation Index, also called RevPAR Index)
Your hotel’s RevPAR divided by the average RevPAR of your competitive set, expressed as an index where 1.0 = fair share. An RGI of 1.12 means your property captures 12% more RevPAR than its fair share of the market.
MPI (Market Penetration Index)
Your occupancy rate divided by the average occupancy rate of your competitive set. MPI above 1.0 means you are filling a higher percentage of your rooms than your compset — you are winning on occupancy. Useful for diagnosing whether RevPAR underperformance comes from a rate problem or a demand problem.
ARI (Average Rate Index)
Your ADR divided by the average ADR of your competitive set. ARI above 1.0 means you are achieving a rate premium over your compset. ARI below 1.0 means you are discounting to compete.
The relationship between these three is where the diagnostic power lies:
| Pattern | What it means | Action |
|---|---|---|
| High RGI, high MPI, high ARI | Outperforming compset on all dimensions | Protect and extend — rate ceiling may have room to grow |
| High MPI, low ARI | Filling rooms by discounting — RevPAR wins come at ADR cost | Raise rate floor, reduce OTA dependency — see Propeter’s Rate Engine |
| High ARI, low MPI | Pricing above demand — rooms going unsold despite strong rate | Review comp set positioning, check channel distribution gaps |
| Low RGI, low MPI, low ARI | Underperforming on every dimension | Comprehensive revenue management review required |
You can use Propeter’s Competitive Intelligence module to track your compset rates — the foundation of meaningful RGI, MPI, and ARI analysis.
RevPAR in Hotels: How Performance Differs by Property Type
One of the most important gaps in standard RevPAR content is the failure to address how the metric behaves differently across hotel categories. RevPAR comparisons only have meaning within the same property type — comparing a luxury resort’s RevPAR to a budget hotel’s RevPAR tells you nothing useful.
RevPAR by Hotel Category: What the Industry Benchmarks Look Like
Luxury and upper-upscale hotels operate at the highest ADR, making their RevPAR the most sensitive to occupancy fluctuation. A 10-percentage-point occupancy drop at a property with a £400 ADR is a £40 RevPAR loss — catastrophic compared to the same occupancy drop at a £100 ADR economy property. Luxury properties typically target RevPAR growth through ADR expansion rather than occupancy maximisation, accepting lower occupancy in exchange for rate premium sustainability.
Boutique and lifestyle hotels — typically 20–80 rooms, strong brand identity — often achieve RevPAR premiums of 15–30% over physically comparable generic properties in the same market. The premium reflects brand differentiation: unique design, curated experience, and higher direct booking mix that reduces OTA commission drag on NRevPAR. If you operate a boutique property, see how Propeter supports boutique hotels.
Apartment hotels and serviced apartments require a different RevPAR interpretation because average length of stay (ALOS) is significantly longer than traditional hotels. A serviced apartment with a lower ADR but an ALOS of 7 nights generates substantially more revenue per booking than a hotel with a higher ADR but a 1.8-night average stay. For this segment, RevPAR per booking window — not just per available room-night — is a more complete measure of revenue performance. See how Propeter approaches serviced apartments and mixed-stay demand.
Hostels present the most unusual RevPAR calculation challenge in hospitality: when revenue comes from bed-level pricing rather than room-level pricing, standard RevPAR needs to be recalculated at the bed level (Revenue Per Available Bed, or RevPAB) to be comparable. A hostel that fills 80% of its beds at £30/bed produces a fundamentally different financial structure than a hotel filling 80% of its rooms at £120/room — even if the room-level RevPAR looks similar.
Vacation rentals calculate RevPAR differently again — typically using the property as the unit rather than individual rooms, and incorporating cleaning fees and minimum-stay revenue in a way that standard RevPAR calculations do not accommodate cleanly.
Why Independent Hotels Use RevPAR Differently Than Chain Hotels
Chain hotels benefit from brand-level RevPAR benchmarking — comparing their RevPAR index against other properties in the same brand family, same tier, and same market. An independent hotel does not have this built-in benchmark. Its RevPAR must be evaluated against a manually constructed competitive set drawn from comparable independent properties — a set that is harder to define and harder to access data for.
This is why independent hotels are disproportionately underserved by standard STR-style benchmarking tools, and why Propeter’s Competitive Intelligence module matters specifically for independents: it provides the compset rate data that independent operators need to calculate meaningful RGI without a brand’s built-in benchmarking infrastructure.
RevPAR Across Hotel Markets: What Industry Trends Actually Show
RevPAR performance in the hotel industry is not uniform — it varies significantly by geography, seasonality, and market segment. These variations matter because a RevPAR figure that looks strong in one market may represent underperformance in another.
RevPAR Trends in Key Global Markets (2025–2026)
India has been one of the strongest RevPAR growth markets globally. Domestic travel demand has grown sharply post-pandemic, Tier 1 cities (Mumbai, Delhi NCR, Bengaluru, Hyderabad) are seeing corporate demand recovery alongside domestic leisure, and leisure markets (Goa, Jaipur, Kerala) are benefiting from growing international inbound. The Indian hotel industry’s RevPAR is disproportionately driven by event and festival demand — Diwali, IPL cricket season, wedding season — creating high-variance windows that reward dynamic pricing and penalise static rate strategies. Event and festival calendars are an input Propeter can include in demand forecasts for Indian properties.
Australia has seen RevPAR recover and grow above pre-2020 levels across most major markets. Sydney and Melbourne CBD hotels have benefited from international conference and event recovery, while leisure markets (Gold Coast, Cairns, Whitsundays) show sharp peak-to-trough RevPAR variance driven by school holiday patterns and inbound seasonality. Australian hotels with strong RevPAR tend to have two things in common: a direct booking strategy that reduces OTA commission drag on NRevPAR, and a demand forecasting approach that accounts for state-by-state school holiday calendars and major event schedules.
Middle East hotel markets — particularly Dubai, Abu Dhabi, and Riyadh — have produced some of the strongest luxury segment RevPAR globally, driven by MICE demand, international leisure, and ultra-high-end F&B and entertainment revenue that lifts TRevPAR well above room-only RevPAR. In these markets, TRevPAR is often a more relevant performance metric than standard RevPAR because ancillary revenue per available room is exceptionally high.
UK and Western Europe hotel markets show more moderate RevPAR growth constrained by cost inflation — rising labour, energy, and food costs have compressed the GOPPAR-to-RevPAR ratio even in years of solid RevPAR performance. This is precisely the dynamic our GOPPAR vs RevPAR guide addresses: RevPAR can grow while profitability falls, which is why GOPPAR tracking via Propeter’s Xero Accounting integration is increasingly essential for European independent hotels.
Seasonality and RevPAR: How to Interpret Monthly Movements Correctly
A common mistake in hotel RevPAR analysis is evaluating monthly RevPAR in absolute terms rather than year-on-year terms. A RevPAR of £85 in January looks poor compared to a RevPAR of £155 in August — but if January last year was £72, the January figure represents a healthy 18% year-on-year improvement. Always evaluate RevPAR against:
- Prior year same period — removes seasonal distortion
- Budget/forecast — measures execution against plan
- Competitive set (RGI) — measures performance relative to market
The Propeter AI Revenue Management System tracks all three simultaneously — prior year, forecast, and compset — and surfaces RevPAR variance alerts when performance deviates from expected trajectory, so the response is proactive rather than retrospective.
The Limitations of RevPAR That the Hotel Industry Is Starting to Acknowledge
RevPAR is the dominant hotel industry metric — but it has well-documented limitations that are increasingly relevant as the industry matures and profitability becomes the primary focus of owners and investors.
Limitation 1: RevPAR ignores the cost of filling rooms
A hotel at 95% occupancy with a £120 ADR produces a RevPAR of £114. A hotel at 70% occupancy with a £160 ADR produces a RevPAR of £112. The RevPAR figures are nearly identical. But the first hotel is paying housekeeping for 95 rooms, the second for 70 rooms. Labour, laundry, amenities, and energy costs are proportional to rooms occupied — not to RevPAR. The first hotel’s GOPPAR may be meaningfully lower than the second’s, even with a marginally higher RevPAR. This is why GOPPAR vs RevPAR is an increasingly important comparison in hotel industry analysis.
Limitation 2: RevPAR does not capture distribution cost
Two hotels with identical RevPAR — one with 65% OTA bookings at 20% commission, one with 65% direct bookings at near-zero acquisition cost — have NRevPAR figures that differ by up to 13 percentage points. The industry is gradually shifting toward NRevPAR as a supplementary metric precisely because RevPAR flatters OTA-heavy hotels whose retained revenue is substantially lower than their headline figure suggests. Propeter’s Direct Booking Engine is specifically designed to widen the gap between RevPAR and NRevPAR in your favour — by shifting the booking mix toward high-margin direct channels.
Limitation 3: RevPAR excludes ancillary revenue
A hotel generating £50 per occupied room per day in F&B, spa, parking, and upsell revenue has a TRevPAR 40–50% above its room RevPAR. A hotel generating £8 per occupied room in ancillary revenue does not. RevPAR treats both identically. For full-service hotels, boutiques with strong F&B programmes, and destination resorts where ancillary spend is high, TRevPAR is a more complete measure of commercial performance — and the ancillary revenue captured per guest is a direct output of Propeter’s pre-arrival upsell automation and Guest Loyalty & Gamification platform.
Limitation 4: RevPAR does not distinguish between guest types
A hotel that fills 80% of rooms with guests paying an average of £130 ADR via OTA has the same RevPAR as a hotel filling 80% of rooms with loyalty members paying £130 ADR directly. But the second hotel’s guests have lower acquisition cost, higher repeat visit probability, higher ancillary spend, and stronger review score contribution. RevPAR is blind to guest quality. The Marketing CRM & Analytics module addresses this by segmenting revenue performance by guest type — so you can see not just your overall RevPAR but the RevPAR contribution of your highest-value 20% of guests versus the rest.
How to Use RevPAR to Drive Better Pricing Decisions in Practice
Understanding RevPAR theoretically is step one. Using it to make better daily pricing decisions is where most independent hotels stall — because without the right data infrastructure, RevPAR is a lagging metric reviewed at month-end rather than a live tool guiding daily rate decisions.
Here is a practical framework for keeping RevPAR actionable on a daily basis:
Daily: Check booking pace versus forecast for the next 14 and 30 days. If pace is ahead of forecast, you should be seeing recommendations to raise rates — verify guardrails are not suppressing them. If pace is behind, check whether the issue is a distribution gap or a rate gap using the Competitive Intelligence dashboard.
Weekly: Review rolling RevPAR versus prior year for the next 90 days. Identify dates where RevPAR is tracking below prior year and determine whether the driver is occupancy (MPI problem) or rate (ARI problem). Use the Demand Forecast Tool to model alternative rate scenarios.
Monthly: Calculate GOPPAR alongside RevPAR using Xero integration data. If GOPPAR is growing more slowly than RevPAR, examine distribution cost growth (OTA mix increasing) and departmental cost growth (labour, energy). Use the ROI Calculator to model the RevPAR and GOPPAR impact of shifting booking mix toward direct.
Quarterly: Run a full RevPAR index review against the competitive set. Evaluate ARI and MPI independently. If ARI is declining, rate strategy needs review. If MPI is declining, distribution and marketing strategy needs review. Both problems need different solutions — and confusing one for the other is expensive.
The Propeter revenue management module supports the daily and weekly layers of this framework — surfacing the right data at the right time, recommending rate changes for your team to approve, and alerting the GM or revenue manager when a date needs attention. The monthly and quarterly strategic review remains a human function; Propeter provides the data that makes those reviews accurate and fast rather than slow and approximate.
How Propeter Optimises for RevPAR
Propeter’s pricing recommendations are built with a single primary objective: maximise RevPAR across the forward booking window. Every recommendation is evaluated against its projected RevPAR effect, not just its ADR or occupancy outcome in isolation.
The pricing engine combines the demand forecast (from gradient-boosted and recurrent neural-network models) with competitor rate context. It models the expected occupancy outcome at different rate levels, using price-elasticity estimates derived from the hotel’s own history, and selects the rate that maximises expected RevPAR for each date and room type.
The recommendation then passes through Propeter’s rate engine, which applies the hotel’s commercial rules in sequence — base rate, inventory position, rate plans and derived rates, promotions, loyalty discounts and vouchers, stacking rules, guardrails, upsell and finally taxes and fees — before your team reviews and approves it. Approved rates are then published through your connected PMS and distribution systems.
The result is a rate strategy that optimises RevPAR holistically: not by mechanically maximising ADR, and not by filling rooms at any cost, but by consistently finding the rate point that maximises total rooms revenue per available room across every future date.
Frequently asked questions
Why should hotels use Net RevPAR (NRevPAR) instead of standard RevPAR?
Hotels should use Net RevPAR (NRevPAR) because standard RevPAR fails to account for distribution costs, wholesale margins, and OTA commissions. A hotel might display a healthy public RevPAR, but if those bookings are heavily driven by high-commission third-party channels, the true revenue retained by the property is drastically lower, making NRevPAR a more accurate measure of net profitability.
Why can two hotels with the same RevPAR have completely different profit margins?
Two hotels with the same RevPAR can have different profit margins because RevPAR ignores variable operational costs. A hotel that hits a $100 RevPAR via 100% occupancy and a $100 ADR incurs massive housekeeping, laundry, and utility expenses. Conversely, a hotel achieving a $100 RevPAR via 50% occupancy and a $200 ADR preserves its Gross Operating Profit Per Available Room (GOPPAR) by minimizing operational wear and tear.
How do out-of-order (OOO) rooms affect ADR and RevPAR calculations?
Under the USALI reporting standard, out-of-order (OOO) rooms stay in the “rooms available” denominator, so taking rooms out of service does not improve reported RevPAR — it simply means fewer rooms can be sold. Some PMS configurations exclude OOO rooms from available inventory, which overstates RevPAR and makes comparisons with the compset and with prior years unreliable. Check how your PMS treats OOO and out-of-service (OOS) rooms, keep the classification consistent, and reconcile to the USALI definition when reporting externally.
What is the difference between RevPAR and ADR?
ADR (Average Daily Rate) measures the average rate achieved per occupied room — it reflects pricing performance. RevPAR (Revenue Per Available Room) measures revenue per available room, incorporating both occupancy and rate. RevPAR = ADR × Occupancy %. RevPAR is the more complete metric because it accounts for unsold rooms, making it a better measure of overall revenue performance.
Can ADR rise while RevPAR falls?
Yes — this is one of the most important revenue management failure patterns to understand. If a hotel raises rates significantly (ADR rises) but loses enough occupancy (too many unsold rooms) as a result, the product of the two — RevPAR — falls. This is why pricing decisions must always be evaluated through the RevPAR lens, not just the ADR lens.
What is TRevPAR and how is it different from RevPAR?
TRevPAR (Total Revenue Per Available Room) incorporates all hotel revenue streams — rooms, food and beverage, spa, parking, events — divided by total available rooms. It provides a more complete picture of hotel revenue performance than room-only RevPAR, particularly for hotels with significant ancillary revenue. Propeter tracks TRevPAR alongside room RevPAR to give a full picture of revenue optimisation opportunities.
How does Propeter optimise for RevPAR?
Propeter evaluates the RevPAR impact of each recommended rate across the booking window — not just the current day. Its forecasting models project occupancy outcomes at different rate levels and select the rate that maximises expected RevPAR for each date. The recommendation then passes through the hotel’s commercial rules and guardrails, and your team reviews and approves it before it is published.
Optimise your RevPAR with AI precision
Propeter evaluates every recommended rate against its RevPAR impact and shows your team the reasoning before anything is published. See what it would recommend for your dates.
Related Articles

How to choose hotel revenue management software for independent properties in Australia
The best hotel revenue management software for independent Australian properties is not determined…

Propeter vs Competitors: Which Hotel Revenue Management Solution Wins?
Propeter is a revenue management and pricing system for hospitality that works with your PMS, with a direct booking engine, guest CRM, loyalty…

Low Season Hotel Strategy: Maximize Occupancy & Revenue (2026)
Maximising hotel occupancy and revenue in low season is not about discounting your…
Calculate your RevPAR
Apply the formulas in this guide to your own occupancy and ADR.